People sensitive to airborne urban pollutants, that is with asthma and COPD, makes up between eight and 13% of California's population (depending on metrics used). Moreover, millions live in areas that are subject to poor air quality due to vehicle emissions or industry. Data from the Bay Area Air Quality Monitoring District (BAAQMD) and other agencies is available on government websites, but is not very detailed, and relatively few people seek this information. There is considerable public interest, but little commercial and inadequate governmental response, in detailed and pertinent AQ data.
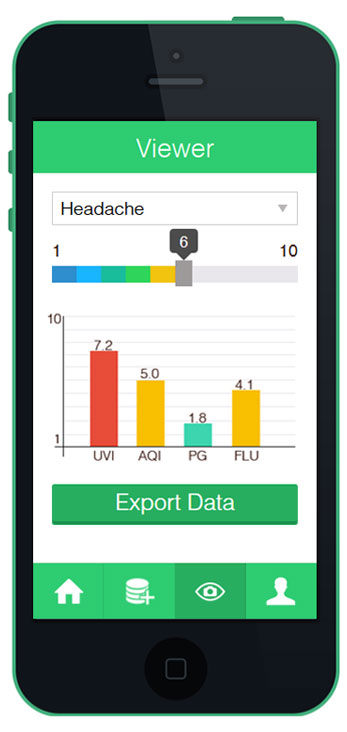
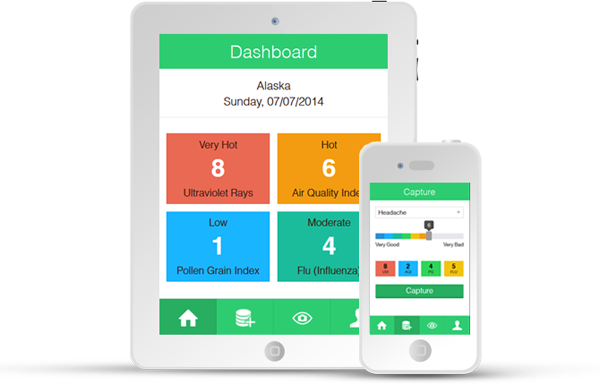
Zoetic Data's tool will provide more accurate and detailed information about local air quality. The beta version of the Urban Dashboard app (for Android and iOS) for self-tracking wellness against environmental data, including AQ data such as particulates, carbon monoxide, and ozone, presents geomapped environmental data to which the user can add his or her own data. The Dashboard needs more detailed data in order to be effective, and so we are starting with a pilot project to use stationary hardware sensors measure standard AQ metrics (O3, PM 2.5 and 10, and CO) in San Francisco's Eastern Neighborhoods (covering BOS Districts 9, 10, and 11).
We are working with governmental and community stakeholders on our pilot project. Ideally, we want the hardware to provide open data, and the sensors to be owned by the City or the BAAQMD. Getting permission from governmental agencies is proving arduous and ongoing. We are hoping to start by simply fixing low-cost wireless sensors on private houses in any of the Eastern Neighborhoods, in the next several months, and paying for the sensors with crowdfunding. We hope to engage communitygroups and private citizens who are concerned about air quality in plans for the specifics of our pilot project. This will tell users about 1) air pollution conditions in their immediate neighborhood; and with the ongoing usage of the app, 2) their characteristic responses to it. Low-cost, pragmatic and relevant digital tools such as the Urban Dashboard can provide a prototypical model for urban open data, establishing AQ as environmental data typically integrated into health care and public urban infrastructure.


Track your mood, health, allergic reactions, headache, or energy levels against time or against weather.
You can input the data from your DIY, Hackerspace, or Citizen Science readings and track environmental data against weather.